Financial Indicators
Table of Financial Indicators(Consolidated/IFRS)
Notes:
- Indicated figures are rounded off.
Definition of terms:
Glossary
Graphs of Financial Indicators(Consolidated/IFRS)
|
Equity attributable to owners of the parent company per share
|
Basic earnings per share
|
|
[Yen] |
[Yen] |
 |
 |
|
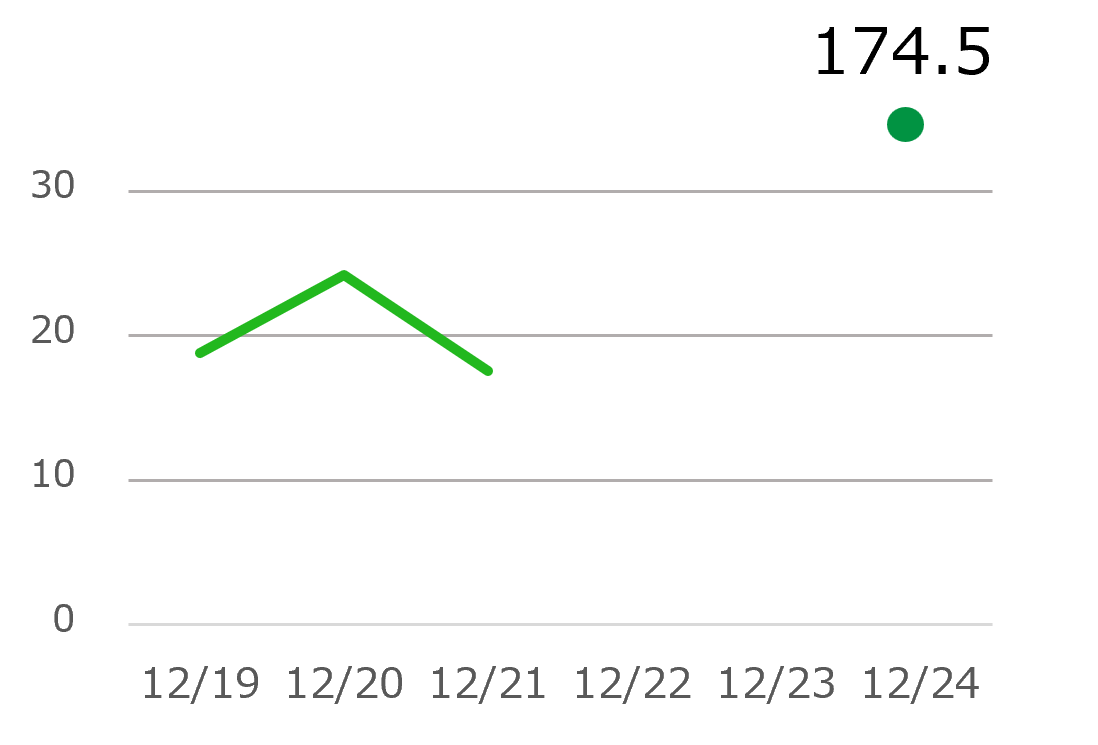
Price-earnings ratio (PER)
|
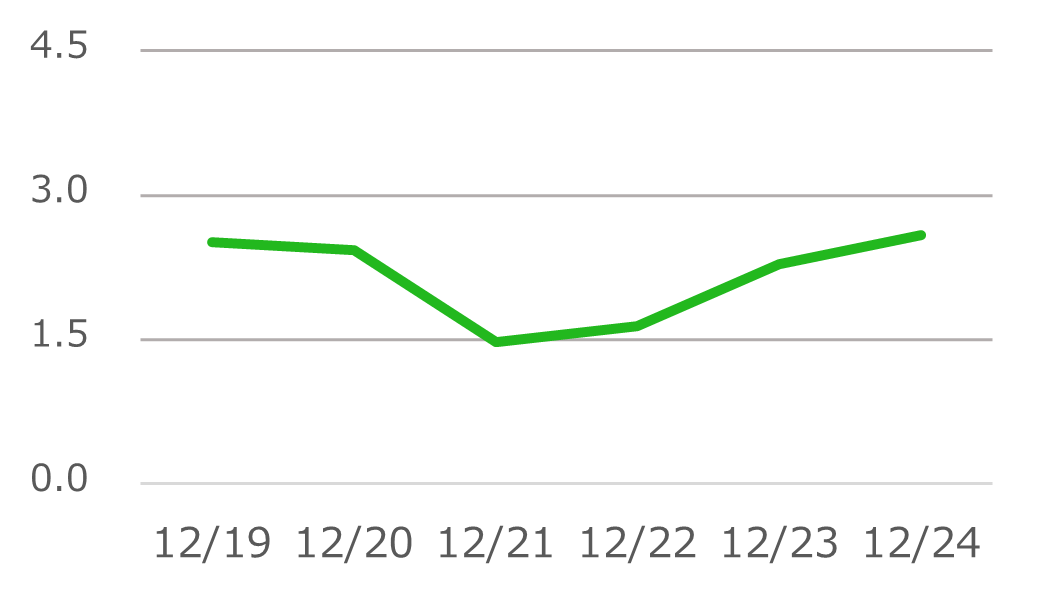
Price to per-share assets
attributable to owners of the parent
company ratio (PBR)
|
|
|
|
 |
 |
|
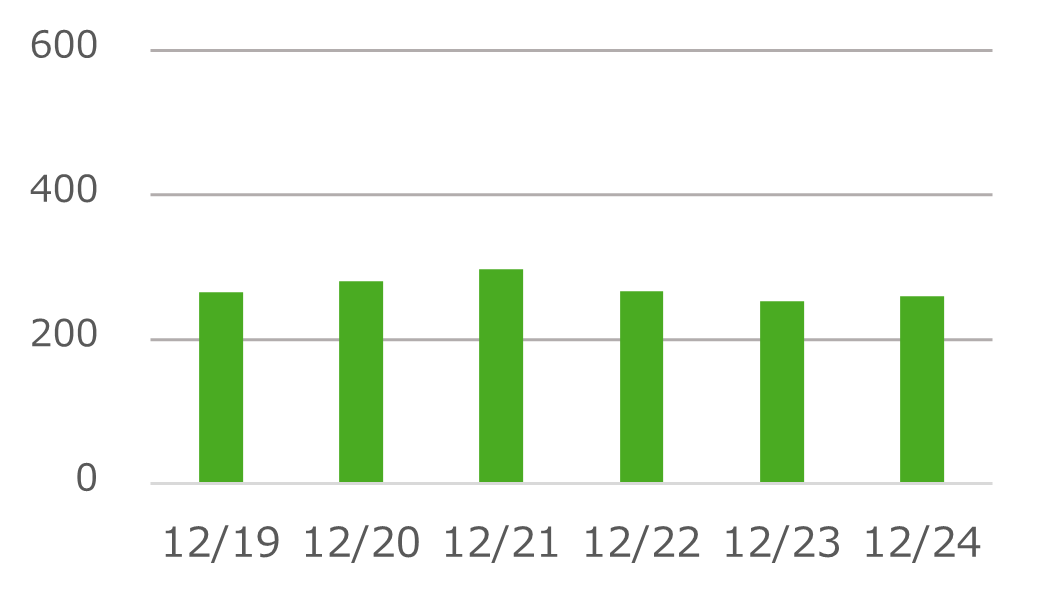
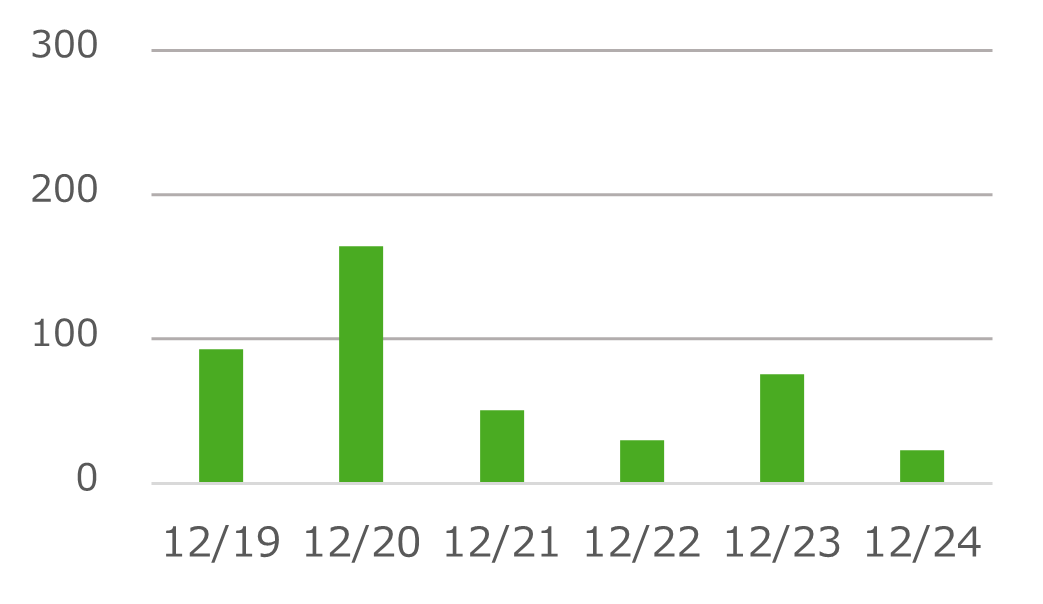
Research and development expenses
|
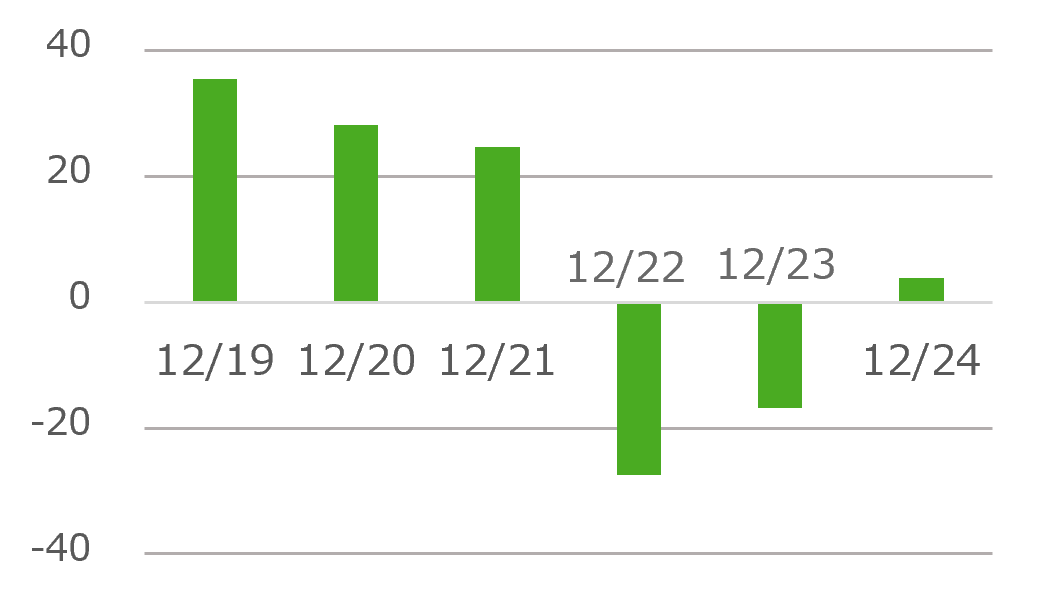
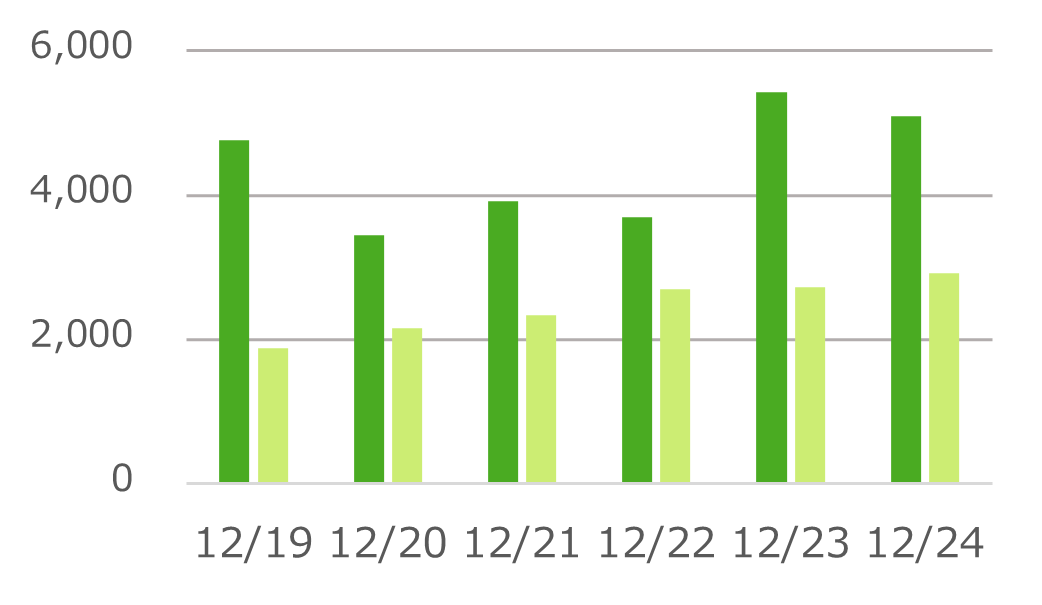
Capital investment / Depreciation and amortization expenses
|
|
[Million Yen] |
[Million Yen] |
 |
 |