Stock Overview
As of the end of December 2023
| Stock exchange listed |
Prime Market of the Tokyo Stock Exchange |
| Securities code |
3673 |
| Sector |
Information and communication sector |
| Fiscal year |
From January 1 to December 31 |
| Annual general meeting of shareholders |
Within 3 months from the following date of the last day of the fiscal year |
| Auditing firm |
KPMG AZSA LLC |
| Record date for dividend of surplus |
December 31 for year-end dividend and June 30 for interim dividend |
| Administrator of shareholder registry |
Mizuho Trust & Banking Co., Ltd. |
| Share unit |
100 shares |
| Lead managing underwriter |
Nomura Securities Co.,Ltd. |
| Method of public notice |
Notice is made public electronically.
(Notices will be published in the Nihon Keizai Shimbun as the method of public notice in the event that electronic means is not available for public notice.) |
Number of Shares Issued/Capital Amount
As of the end of December 2023
※Capital amount is rounded off.
Major Shareholders
As of the end of December 2023
1. The Company holds 6,255,273 shares of treasury shares but are excluded from the above major shareholders.
2. The percentage of shares held is calculated by deducting treasury shares from the total number of shares issued and including 1,311,500 shares held by the Board Benefit Trust (BBT) and 1,528,451 shares held by the Japanese version of Employee Stock Ownership Plan (J-ESOP).
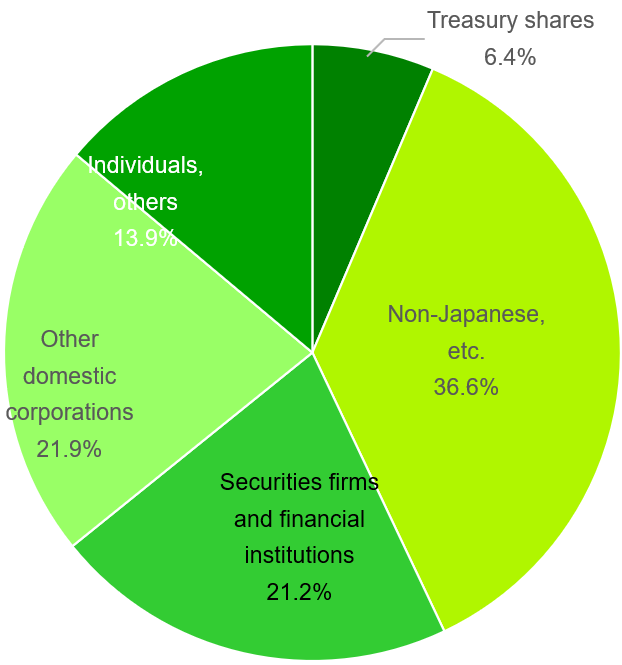
Breakdown of Shareholders
Breakdown of Shareholders by Owners
As of the end of December 2023
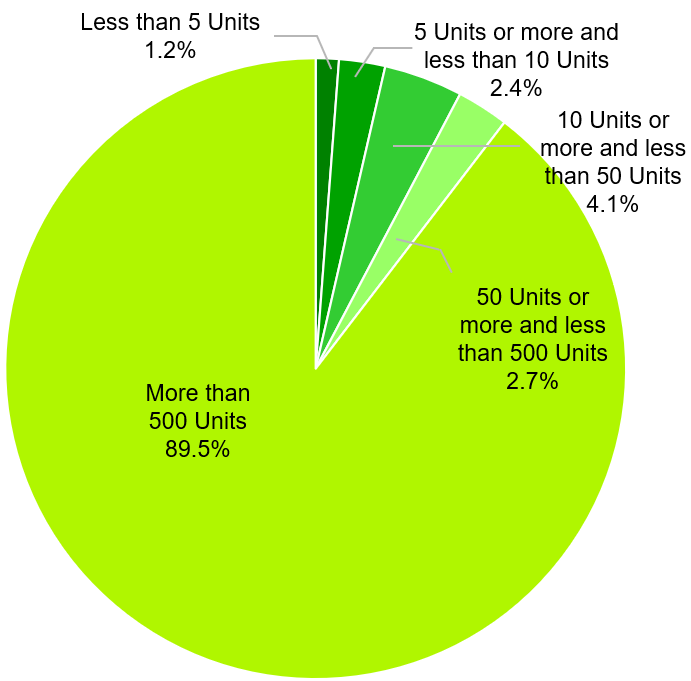
Breakdown of Shares by Numbers
(Including Treasury Shares)
As of the end of December 2023
Stock Index
Stock Index which adopted the stock of Broadleaf Co., Ltd. is the following
(Recognized by Broadleaf: as of March 2024)
・TOPIX Small 1